Daily forecast email
Tomorrow's risk in your inbox at 21:00, with a morning run at 09:00.

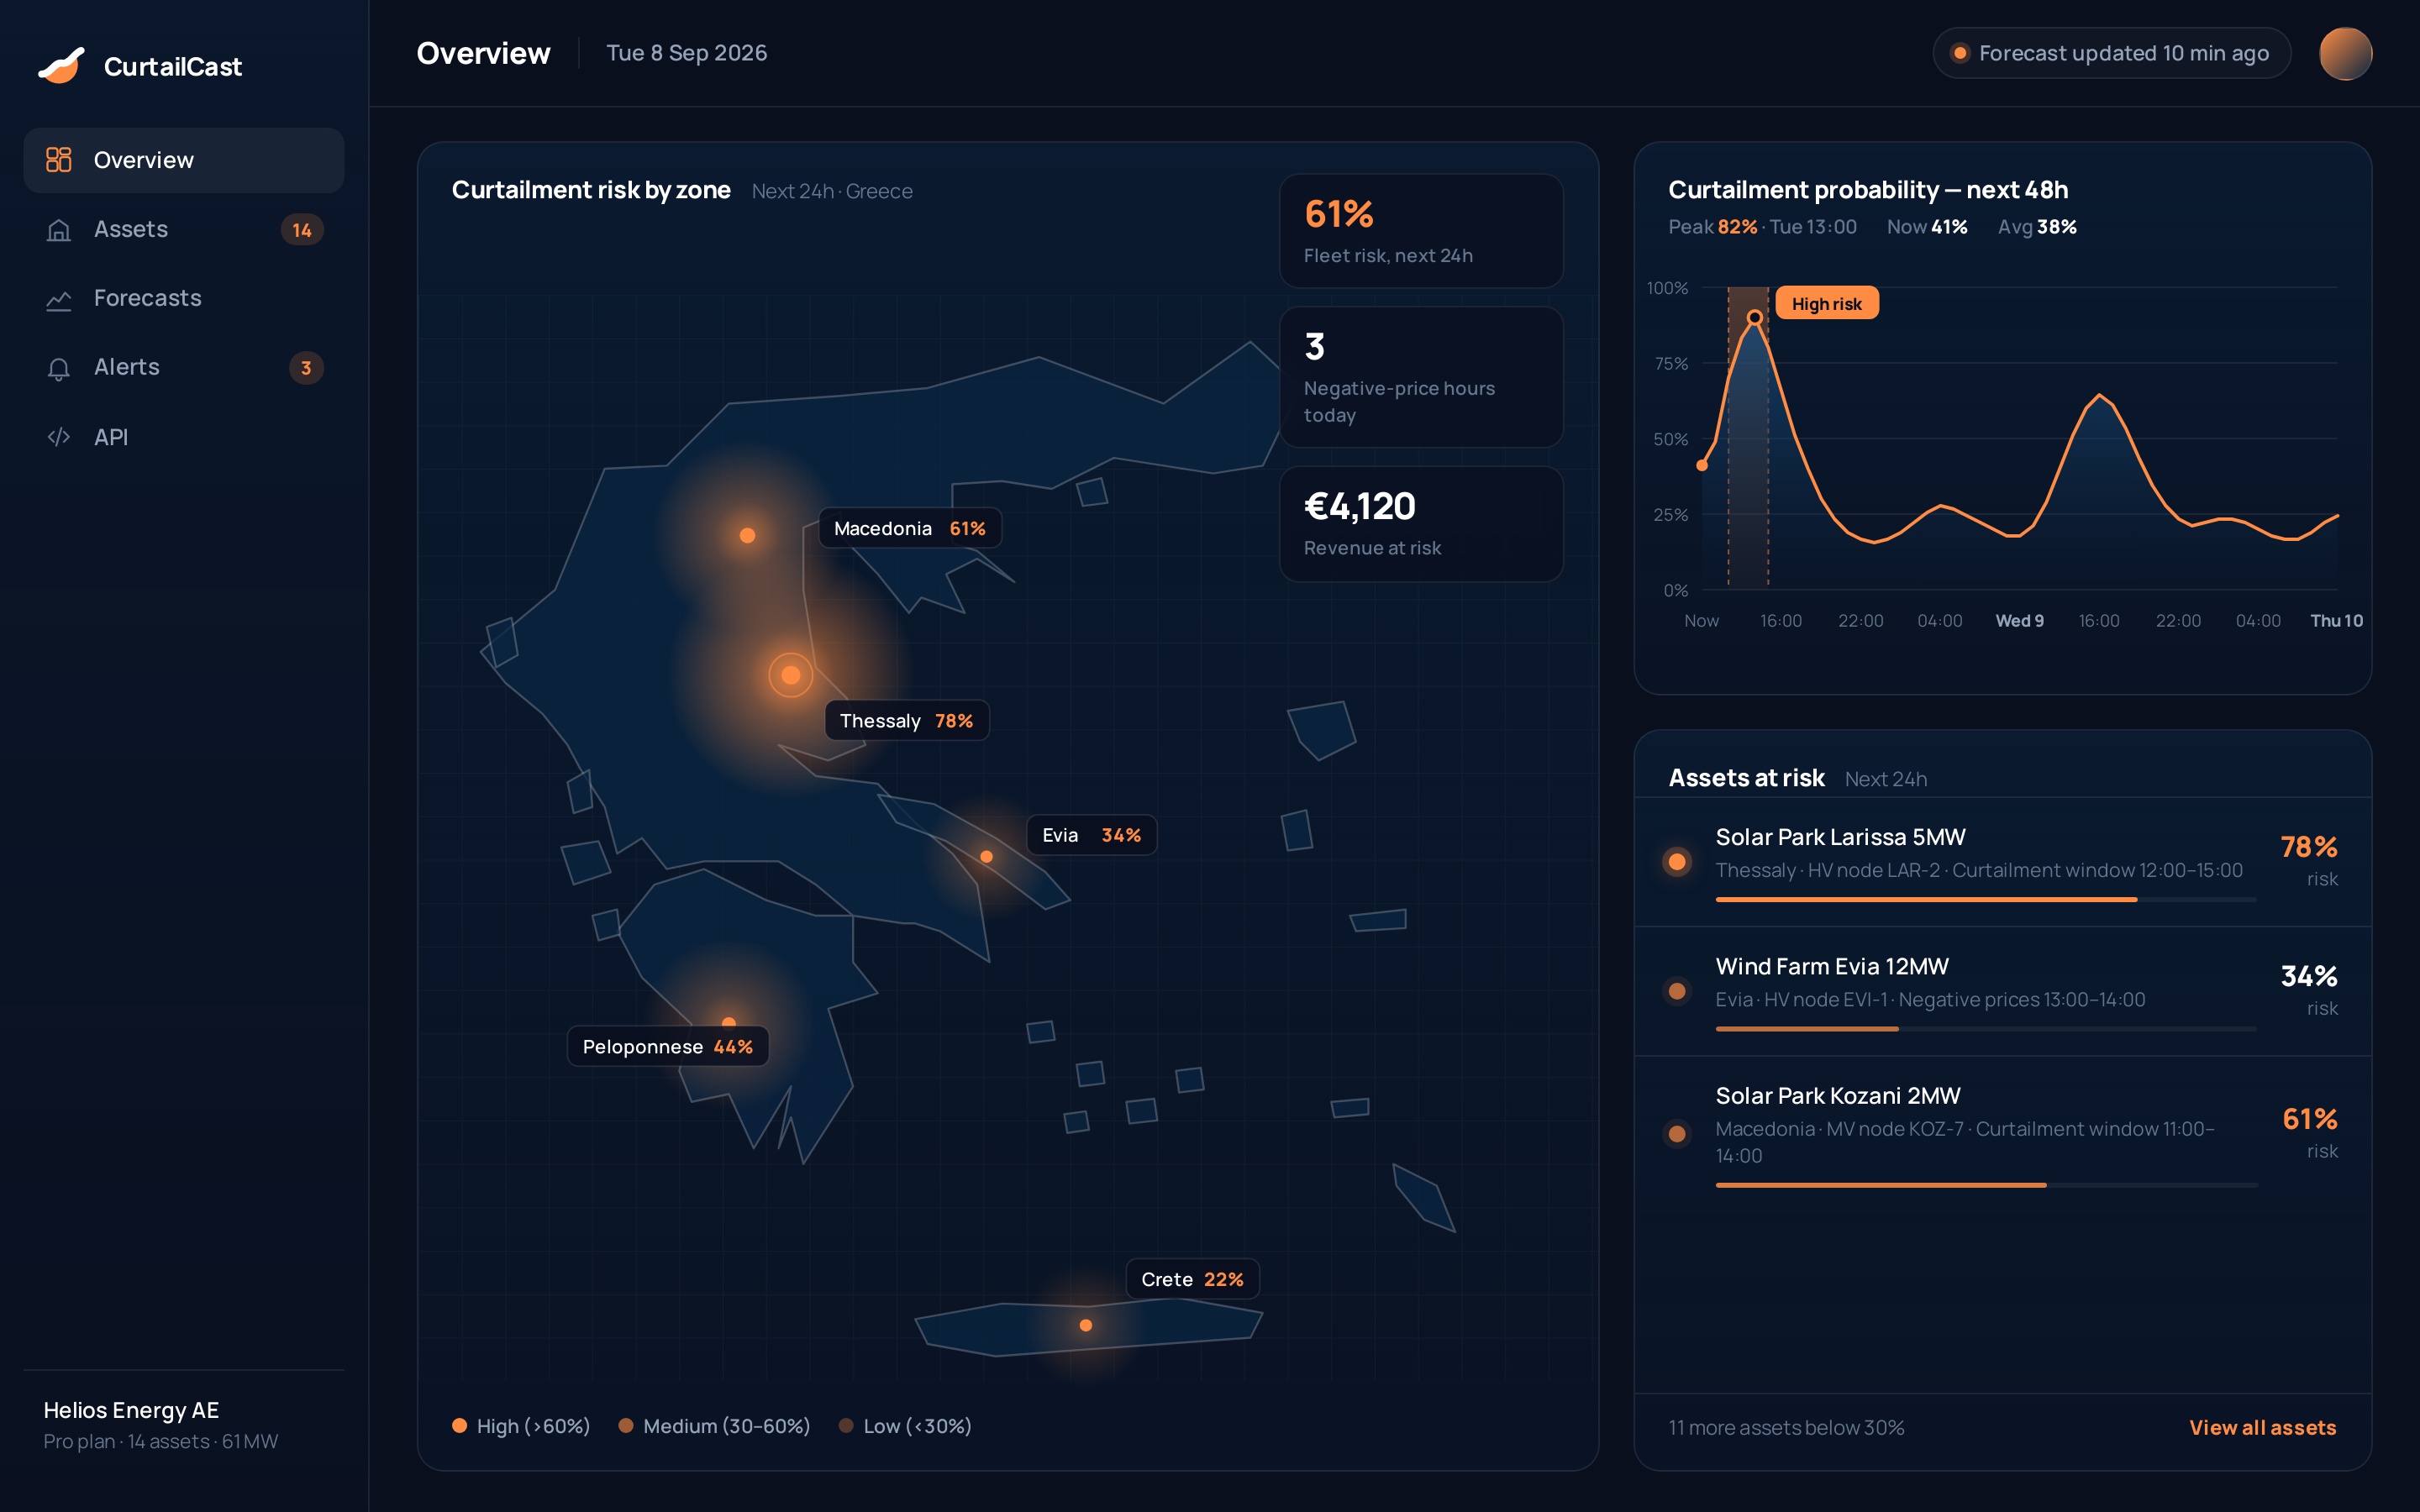
CurtailCast forecasts curtailment risk and negative-price hours for every grid zone, solar and wind separately — powered by European satellite data and AI.

zero & negative-price hours in Q1 2026 alone
of renewable production expected curtailed in 2026
revenue lost by small producers in peak months
Greek market data, IPTO/ADMIE & producer associations, 2026
We use Copernicus CAMS atmospheric products — built on Meteosat and Sentinel observations — to track dust and irradiance conditions per grid zone.
Our AI fuses atmospheric, weather and market data to model grid stress and curtailment probability per zone and technology.
You get the zone-level forecast for your technology twice a day. Plan maintenance, protect revenue, bid smarter.
Know tomorrow's curtailment risk tonight. Plan maintenance on curtailed hours and protect feed-in revenue.
Feed curtailment probability into day-ahead and intraday bids. Cut imbalance penalties across your portfolio.
Charge when prices go negative, discharge at evening peaks. Curtailment forecasts turn batteries into arbitrage machines.
You get tomorrow's forecast: 82% curtailment probability, 12:00-15:00, your zone.
You schedule panel cleaning and inverter checks inside the curtailment window.
Grid curtails your zone. Your maintenance is done during hours you couldn't sell anyway.
You sold the remaining hours at full price. Zero productive hours lost.
One avoided bad decision per month pays for CurtailCast.
Built for Greek terrain and Greek weather.
Tomorrow's risk in your inbox at 21:00, with a morning run at 09:00.
Hour-by-hour probability for tomorrow, daily outlook to day ten.
See which hours are likely to drop below zero before they do.
Exportable records of curtailed energy for claims.
All your parks, one screen.
Plug forecasts into your EMS, SCADA or trading stack.
Open Earth-observation programmes we build on. Data sources, not partnerships.
Something else? hello@curtailcast.com
Copernicus CAMS atmospheric products (built on Meteosat and Sentinel observations), Open-Meteo numerical weather forecasts, IPTO/ADMIE curtailment reports and Greek day-ahead market data from ENTSO-E and HEnEx. Everything is fused per grid zone and technology, twice a day.
No — we only need your park's location and capacity. No hardware, no SCADA access required to start.
Every forecast is compared against what actually happened: negative-price hours the next day, and curtailed capacity once IPTO/ADMIE publishes its monthly report. The performance history is openly available, and accuracy per zone improves as pilots run.
Greece first — seven mainland grid zones, PV and wind separately. Crete, then Iberia and Italy, are on the roadmap.
Early access is free for pilot parks. Commercial pricing is set after the pilot phase.
Tell us about your assets and we will reply within one working day with the next steps for a pilot forecast.
Request received.
Thanks. We have sent you a confirmation and will reply within one working day.
Prefer email? hello@curtailcast.com